Data and Graphs — 2nd Grade Lesson
Students will collect data, record it in tally charts and graphs, and answer questions by reading the data.
2nd Grade · Data & Graphs · ~25 min lesson
What is data?
Data is information — like how many children like dogs, cats, or birds. Graphs organize data so we can see the answer at a glance.
Tally charts
A tally chart records counts using marks in groups of five: four vertical lines and one diagonal across them.
llll= 5,llll lll= 8
Bar graphs
A bar graph shows amounts as bars. The height of the bar matches a number on the side scale.
A bar reaching 9 means 9 of that item.
To compare: the taller the bar, the more there are.
Picture graphs
A picture graph uses pictures or symbols. Check the key — one symbol can stand for more than one item.
Key: one smiley = 2 children. Three smileys = 6 children.
Reading questions to answer
- How many in each category? (read the tally, bar, or symbols)
- Which has the most? Which has the fewest?
- How many more does one category have than another? (subtract)
How to practice at home
- Survey the family: ask “pizza or tacos?” and tally the answers.
- Tally your walks: count red cars in groups of five.
- Draw a bar graph of favorite colors and ask “which has the most?”
- Read labels together: compare the graphs in books and cereal boxes.
Practice with the exercises above, then download these free printable worksheets:
Practice Exercises
Try these on your own, then reveal the answer to check.
A tally mark group looks like 'llll'. How many does one group represent?
💡 Four marks plus the diagonal makes five.
How many tally marks is 'llll lll'?
💡 One group of 5 plus 3 = 8.
A bar on a bar graph reaches the number 4 on the scale. What does that mean?
💡 Read the number the bar reaches on the side scale.
A picture graph key says one symbol = 2 children. You see 3 symbols. How many children?
💡 3 × 2 = 6 — multiply, don't just count symbols.
Which shows more: a bar reaching 9 or a bar reaching 6?
💡 The taller bar is the larger number.
In a tally chart, which has the most: 5 marks or 8 marks?
💡 More marks means more of that item.
Printable Worksheets
Put this lesson into practice with free, printable worksheets — each with an answer key.
Before You Start
- Counting and comparing
- Skip counting by 5s
Common Mistakes to Watch For
- Counting a picture graph symbol as 1 when the key says it's worth more
- Forgetting to include every tally mark (groups of five)
What to Learn Next
Browse more Data & Graphs worksheets or explore all 2nd Grade worksheets.
Related Worksheets
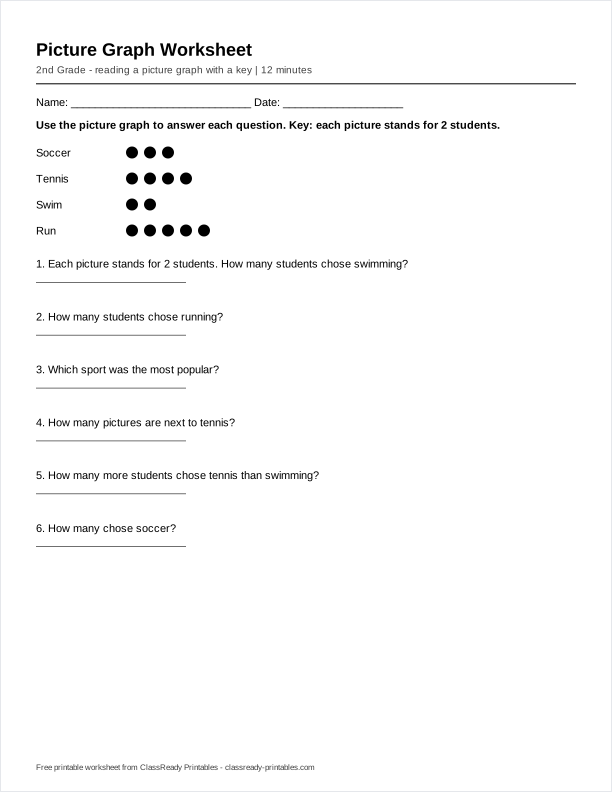
Picture Graph Worksheet
Read the picture graph, where each picture stands for 2 students, and answer questions about the data.
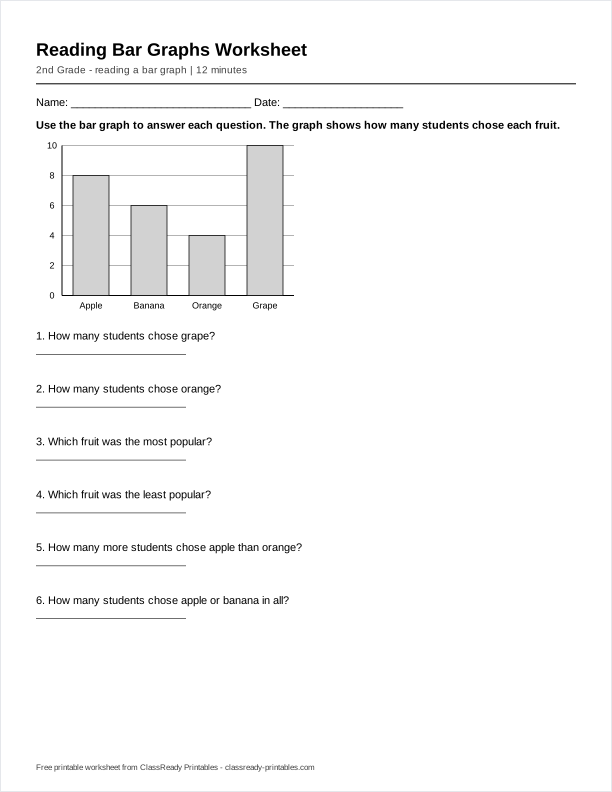
Reading Bar Graphs Worksheet
Read the bar graph and answer questions about the data, including 'how many more' comparisons.
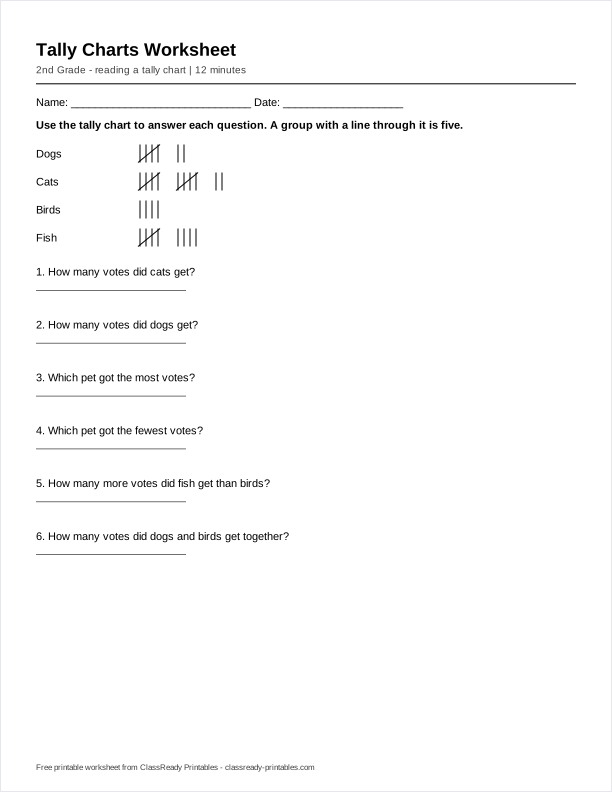
Tally Charts Worksheet
Read the tally chart by counting marks in groups of five, then answer questions about the data.
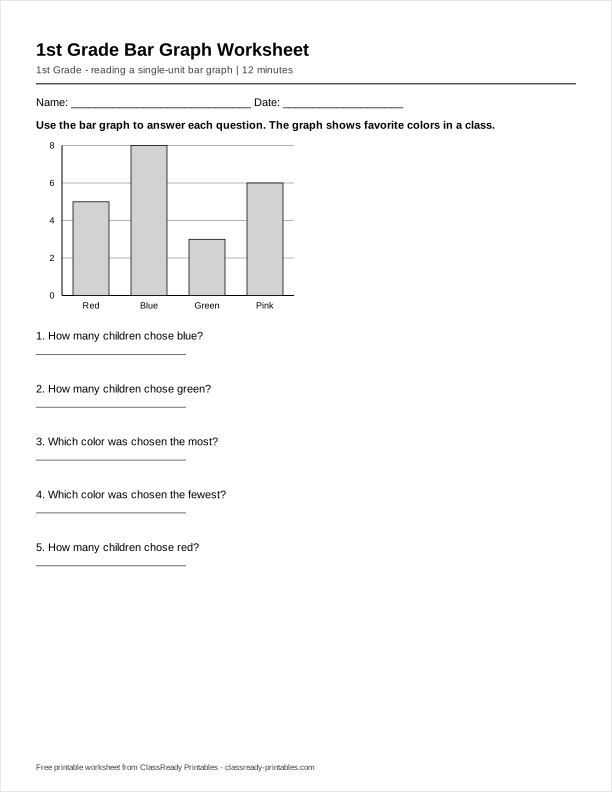
1st Grade Bar Graph Worksheet
Read the bar graph to find how many for each group, then compare the bars.
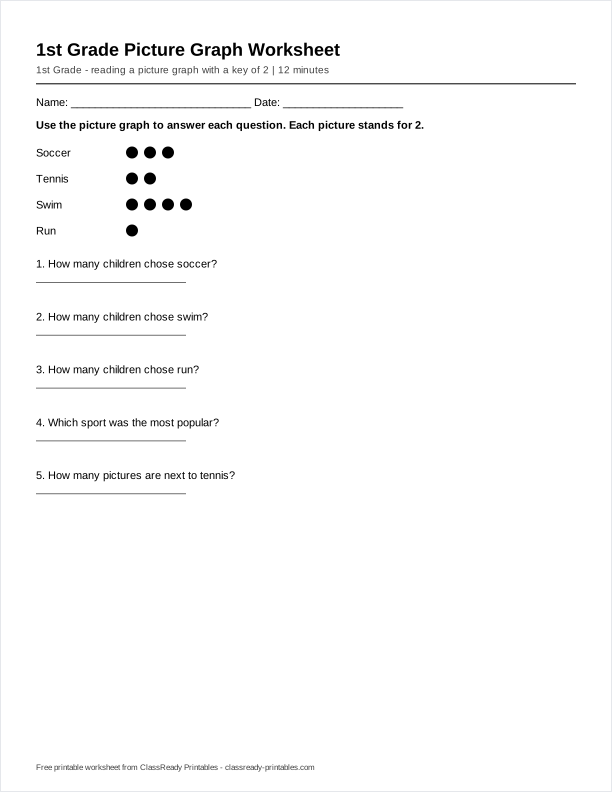
1st Grade Picture Graph Worksheet
Read the picture graph using the key — each picture stands for 2 — then answer the questions.
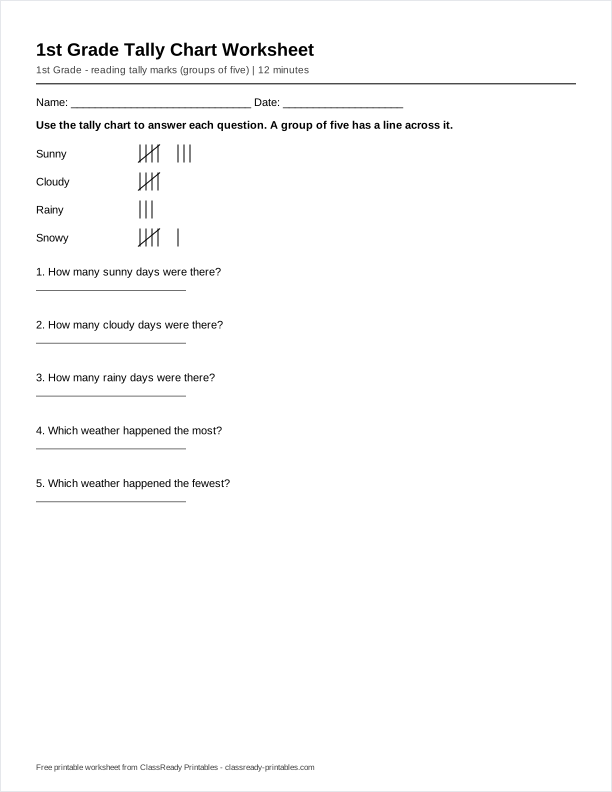
1st Grade Tally Chart Worksheet
Count the tally marks — each group of five has a line through it — then answer the questions.
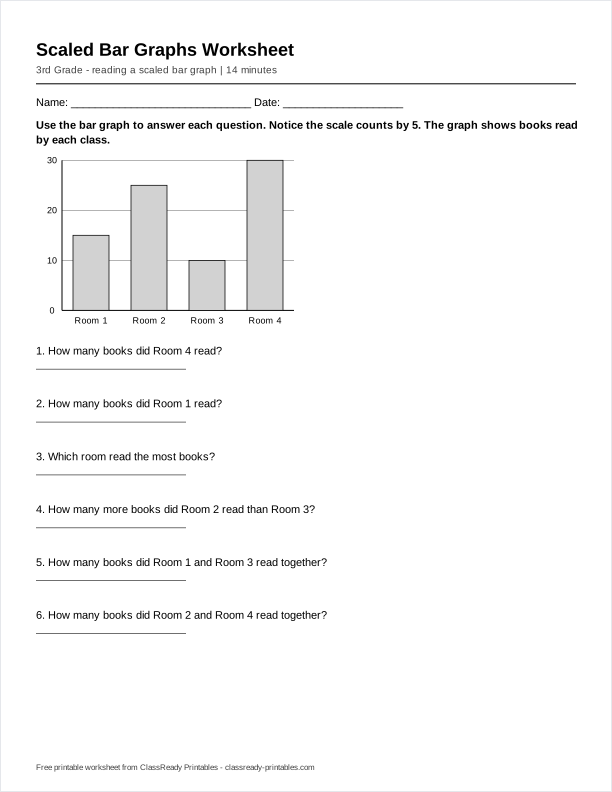
Scaled Bar Graphs Worksheet
Read a bar graph where the scale goes up by 5, then answer questions — including how many more and how many in all.
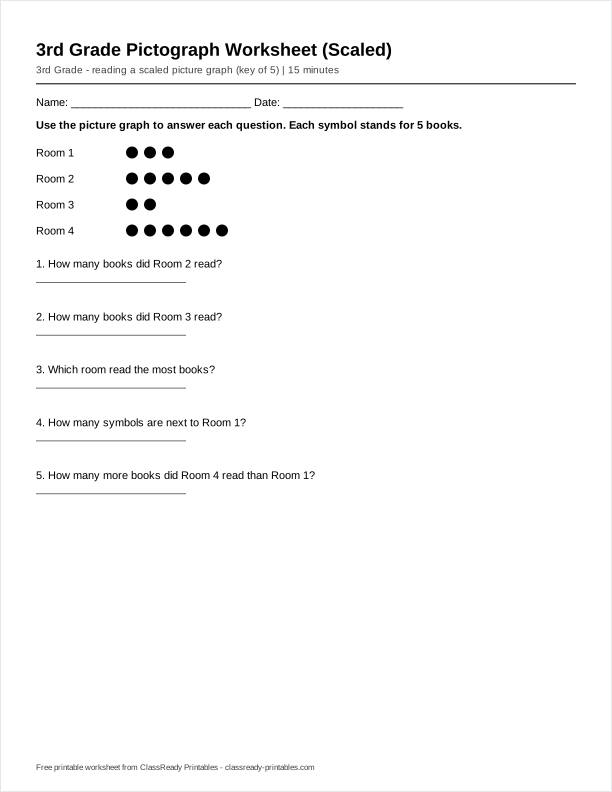
3rd Grade Pictograph Worksheet (Scaled)
Read a scaled picture graph — each symbol stands for 5 — and answer how-many, how-many-more, and total questions.
Frequently Asked Questions
What graphs does a 2nd grader need to read?
Tally charts, bar graphs, and picture graphs. Students should read how many each category has, find the most and least, and compare categories.
What is a tally chart?
A way to count by making marks in groups of five: four vertical lines with a diagonal line across them. Each group of five makes counting totals fast.
Original & reviewed. Every worksheet is created in-house from a grade-level skill brief, checked for a correct answer key, and reviewed for grade-appropriateness. Our editorial policy.